Urna: Brazilian elections and politics, explained with data
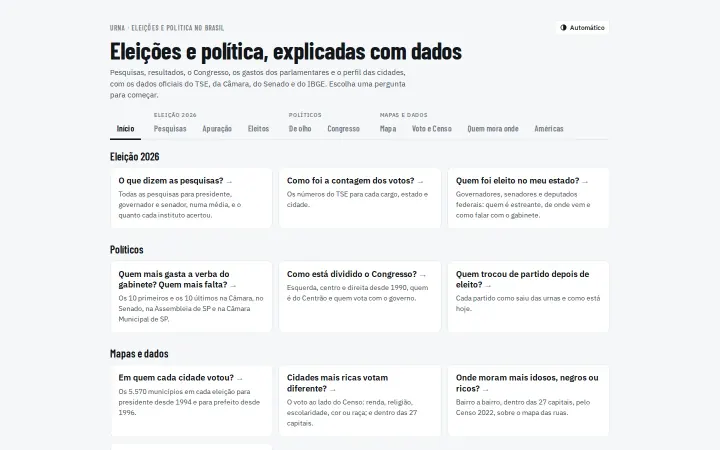
Urna is an election data website that brings together more than 1,300 opinion polls since 2010, presidential results in all 5,570 Brazilian municipalities since 1994, Congress since 1990, lawmakers' spending and the 2022 Census, using official data from Brazil's electoral court (TSE), Chamber, Senate and statistics bureau (IBGE). It was built so anyone can understand elections without being a specialist, and it is the reference for what Gomes Code delivers in data interactives.
Client and context
Urna started with a question: does a city's Human Development Index relate to how it votes? To answer it, I crossed official election results with human development data. One question led to another, and the project grew to cover polls, vote counts, Congress, lawmakers' expenses, the Census and the Americas.
The problem
“I want to know what the polls really say, who got it right last time, how my city voted and whether my representative shows up to work — without opening ten websites or being a statistician.”
Constraints
- Lay audience: the home page had to start with plain questions, not filters.
- Mobile reading, including slow connections, with maps of 5,570 municipalities.
- No server to maintain: running costs had to stay close to zero.
- Data from different official sources, with incompatible names, dates and formats.
- Fixed electoral calendar: the site had to be ready before the 2026 campaign.
Decisions and trade-offs
Static site with a Python data pipeline
Why: Data is validated and generated before publishing, and the site is served as files. There is no database to go down on election night, and hosting costs next to nothing. The trade-off is that every update needs a new build, which was automated.
Each tab downloads only its own data
Why: The page opens with the code and the polls (about 140 KB gzipped), and maps and Census data load only when the reader opens that tab. First visits on mobile stay fast.
Local linear regression instead of a moving average
Why: A moving average lags behind the trend; a local regression weighted by sample size follows change without letting a daily tracker dominate the average.
Plain-language questions at the entrance
Why: Visitors want an answer, not a dashboard. Each question opens the right tab already configured, and a glossary explains terms like valid votes, electoral quotient and Centrão.
Accessibility as a requirement, not an extra
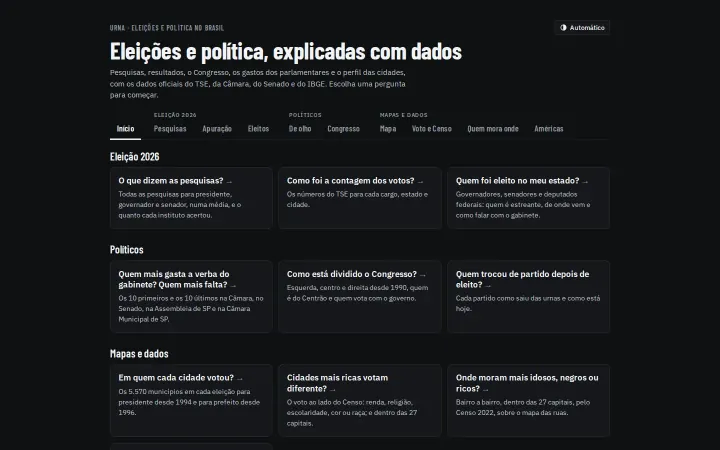
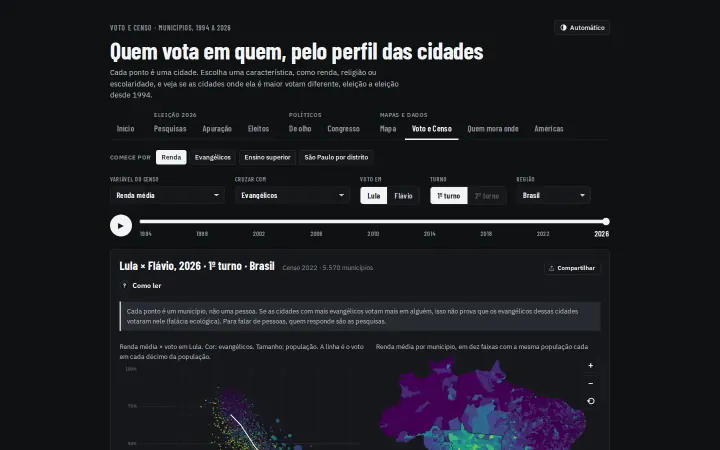
Why: Keyboard-navigable maps, data tables for readers who cannot see the chart, a colorblind-safe palette and light and dark themes.
What we built
- Polls: president from 2010 to 2026 (both rounds) and 2026 governor and Senate races in all 27 states, with a smoothed average, a variation band and a pollster accuracy ranking.
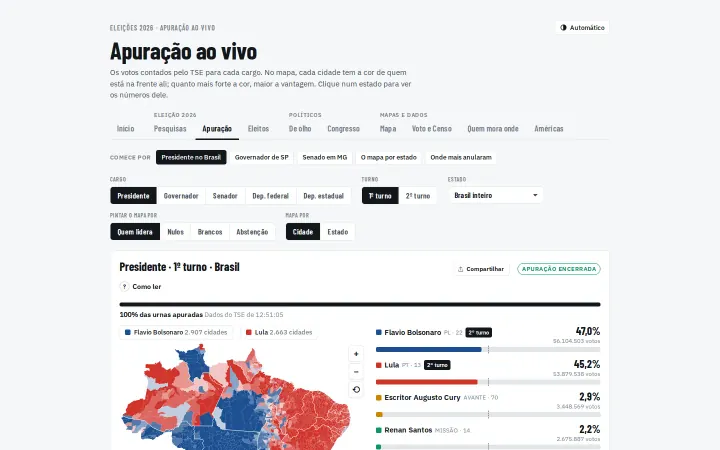
- Live count: TSE results for president, governor, senator and deputies, by state and by municipality.
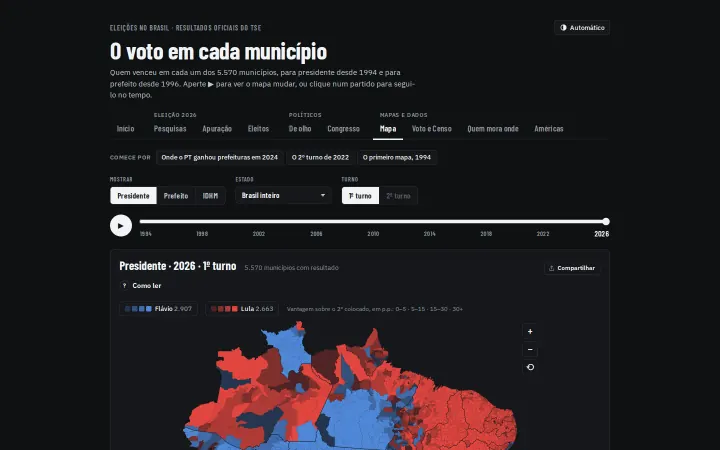
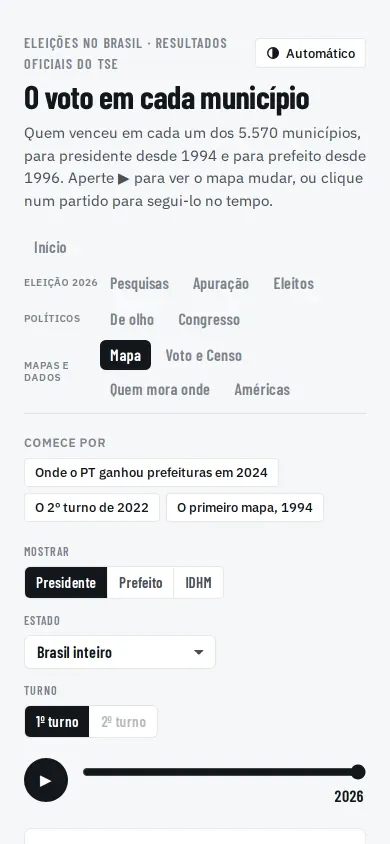
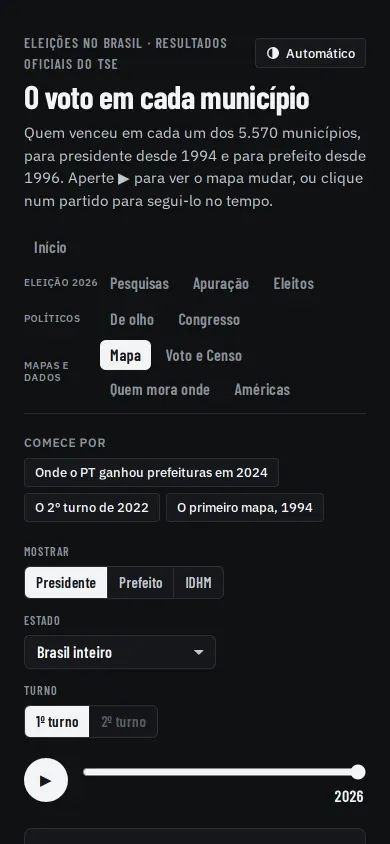
- Map: the winner in each of the 5,570 municipalities in every presidential election since 1994 and every mayoral election since 1996, animated year by year.
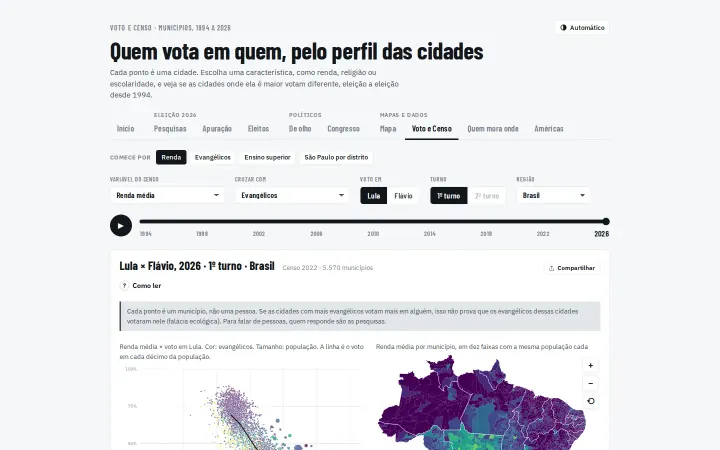
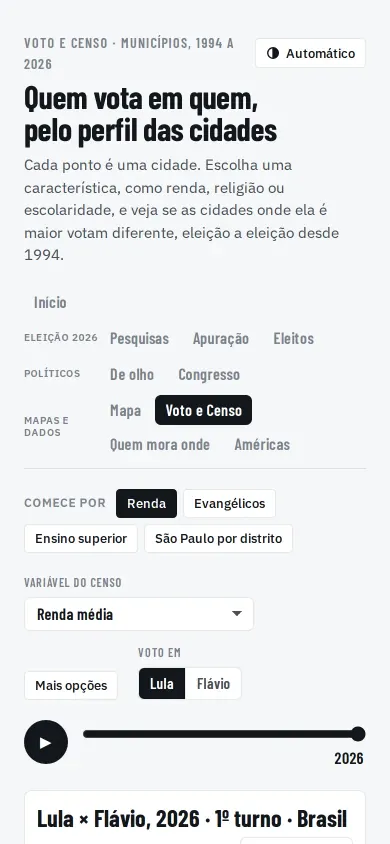
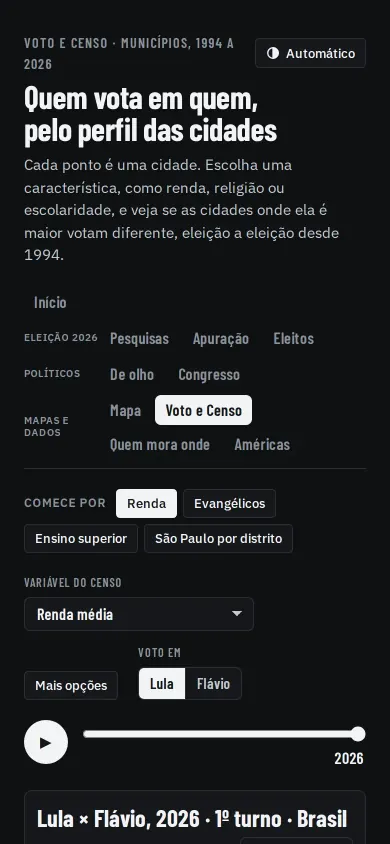
- Vote and Census: each municipality's vote next to income, religion, schooling and race, and inside the 27 state capitals.
- Who lives where: 2022 Census indicators neighbourhood by neighbourhood in the 27 capitals, over a street map.
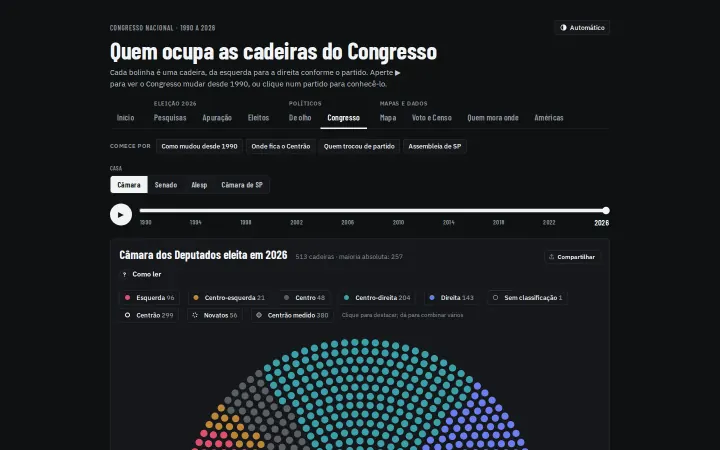
- Congress: Chamber and Senate since 1990, São Paulo's state assembly and city council, with ideological position, the Centrão bloc and the government's base.
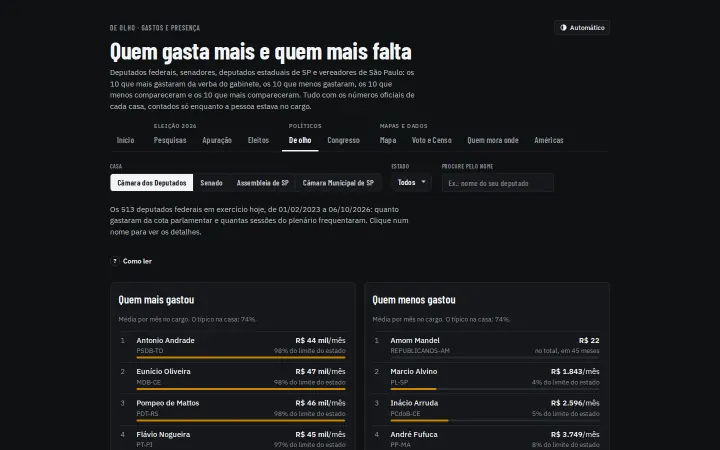
- Watchlist: who spends the most of their office allowance and who misses the most sessions, in the Chamber, Senate, São Paulo assembly and city council.
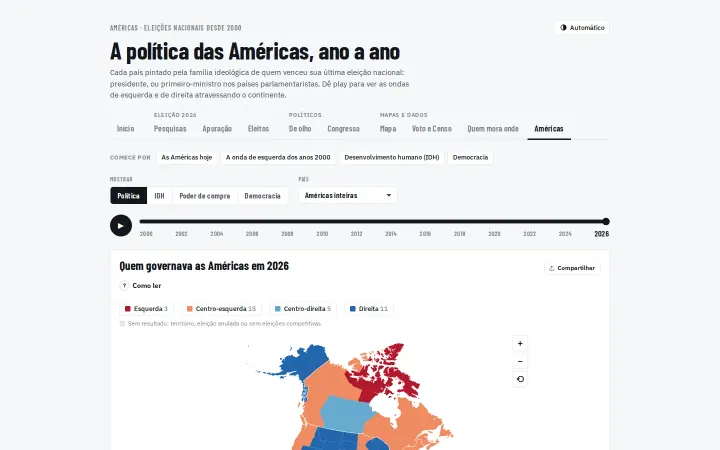
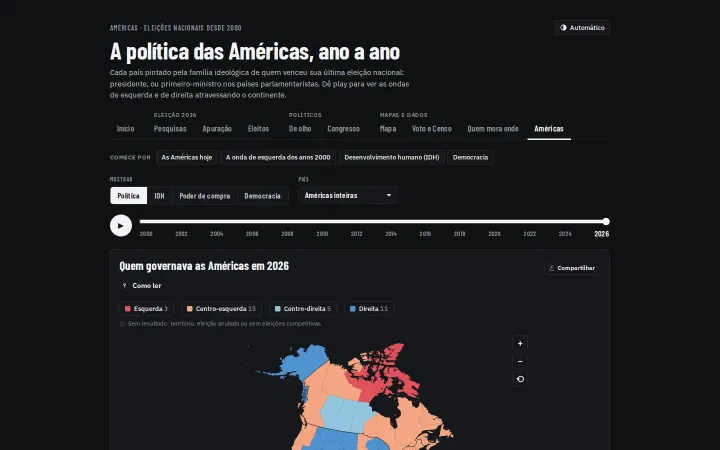
- The Americas: who has governed each country on the continent since 2000, from left to right.






Results
- 759presidential polls from 2010 to 2026, both rounds, from 52 polling firmsSource: Urna's database as of October 5, 2026
- 5,570municipalities in every presidential election since 1994Source: Official TSE data processed by Urna
- 0.19 pointsmean error of the most accurate pollster in the 2022 runoff, as computed by UrnaSource: Pollster accuracy ranking on Urna
- ≈140 KBof gzipped code and data to open the home pageSource: Repository README
This case's tile
Lula's share of valid votes in each region in the 2022 presidential runoff.
| 2022 runoff by region | % of valid votes |
|---|---|
| North | 49 |
| Northeast | 69.3 |
| Center-West | 39.8 |
| Southeast | 45.7 |
| South | 38.2 |
Source: TSE municipal results, processed by Urna · 2026-10-13
Technologies
Want something at this level?
Send the problem, not a spec.